


Summary
WORLD INEQUALITY REPORT 2018
The full report is available in English, but the 20-page summary is available in 8 languages: English, French, Spanish, German, Russian, Arabic, Hindi and Chinese - wir2018.wid.world
Key results of the report include the following
- Strikingly, since 1980 the richest 1% captured twice as much as the poorest 50% of the world's population. In other terms, since 1980, 27% of all new income generated worldwide were captured by the richest 1%, while the poorest 50% of the world's population captured only 13% of total growth. These figures are brought into sharp contrast considering the top 1% currently represents 75 million individuals while the bottom 50% represents 3.7 billion individuals. The population in between, largely comprised of lower- and middle-income earners in North America and Europe, experienced sluggish or even zero income growth rates.
- Since 1980 there have been large shifts in the ownership of capital. Who owns this capital is crucial in determining inequality. Net private capital--the assets of individuals minus their debts--has risen enormously in recent decades, but conversely, net public capital--the assets of governments minus their debts--has declined in nearly all countries since the 1980s due to large scale privatizations and rising public debts. Public capital is now approaching or below zero in rich countries. This exceptional situation by historical standards has strong implications on policy. In particular, it becomes extremely challenging for governments to invest in education, healthcare or environmental protection.
- Wealth inequality among individuals also increased sharply since 1980. Significant increases in top wealth shares have been experienced in China and Russia following their transitions from communism to more capitalist economies. The top 1% wealth share doubled in both China and Russia between 1995 and 2015, from 15% to 30% and from 22% to 43%, respectively.
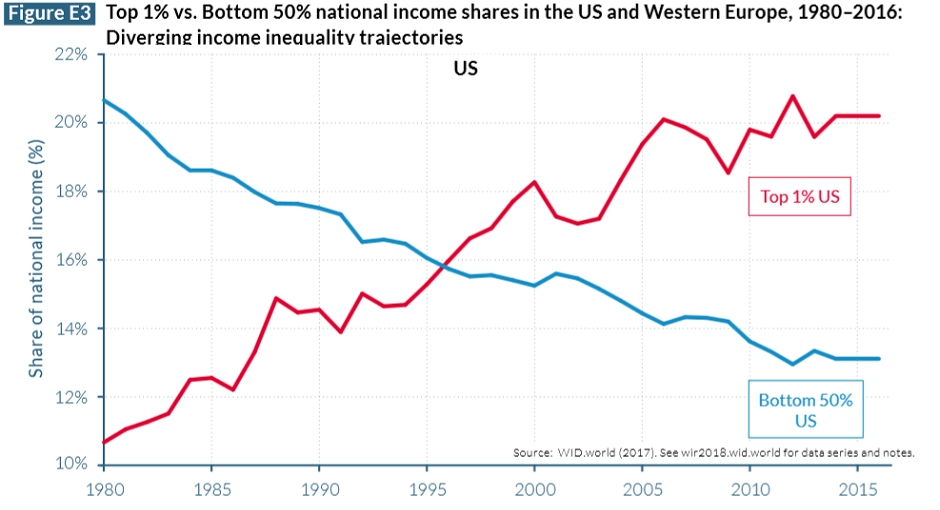
Emmanuel Saez, coordinator of the report, stressed: "The combination of privatizations and increasing income inequality has fueled the rise of wealth inequality—within countries and at the global level, private capital is increasingly concentrated among a few individuals. This rise was extreme in the U.S., where the share of wealth held by the top 1% rose from 22% in 1980 to 39% in 2014."
- Global income and wealth inequality will steadily rise if countries continue to follow the same trajectory they have been on since 1980, despite strong growth in emerging countries. By 2050, the share of global wealth held by the world's 0.1% richest (representing 7.5 million individuals today) be equal to that of the middle class (3 billion individuals).
- However, rising global inequality is not inevitable in the future and limiting it will have tremendous impacts on global poverty eradication. If all countries follow the same inequality trend as Europe since 1980, the incomes of the bottom half of the world population could rise from €3 100 in 2017 to €9 100 in 2050. Alternatively, if countries were to follow the U.S. trend, the incomes of the bottom 50% would rise to just €4 500 by 2050.
The data presented in the report combines in a systematic and transparent manner all available economic data sources, including household surveys, tax receipts, and income and wealth national accounts (including offshore leaks, when available). This enterprise relies on the analysis of more than 175 million data points on inequality.
Facundo Alvaredo, coordinator of the report, said: “This enterprise relies, in one way or another, on the inequality statistics collected in WID.world ?The World Wealth and Income Database? since its inception as the World Top Incomes Database in 2011.
These databases would not have been possible without the cooperation of more than 100 researchers around the world.”